Chromulator-IEX
How to Get the Software?
Chromulator-IEX has been used by top biotech
companies such as Amgen and Genentech. Both academic and commercial buyers need
to pay a license fee ($3k for commercial buyers). Academic discount is
available. Buyer pays our invoice with a check payable to "Ohio University
Foundation." Please e-mail Prof. Tingyue Gu (gu@ohio.edu) for details.
Overview
Chromulator-IEX solves the general rate model
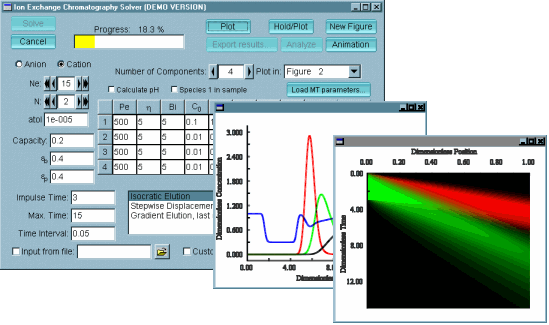
for ion-exchange chromatography, and provides several methods of visualizing
the solution. The solution data can be exported to a MatlabŪ m-file or a
text file. It can be used to model a variety of IE applications including
water treatment and protein separations. The data can be visualized as
effluent histories (chromatograms), position-time plots, and animations
displaying the changing column profiles with time.
Model
Mass
transfer
The flow through the column is assumed to be
axial, with perfect radial mixing in the column. Axial dispersion is
described by the dimensionless Peclet number (Pe). Mass transfer
from the bulk mobile phase to the particle surfaces is described by the Biot
number (Bi). Diffusion within the particle pores is accounted for
by the eta number (lower-case eta).
Equilibrium
The mass-action isotherm is used to describe the
ion-exchange equilibrium. An equilibrium constant is specified for each
component except the first, with the first component being the reference
species. The equilibrium constant can also be specified so that its
logarithm is a polynomial function of the pH. In addition, the absolute
charge (lower-case nu) for each component is specified. This can be a
constant or a polynomial function of the pH. The steric factor
(lower-case sigma) allows for the Steric Mass-Action (SMA) isotherm to be used.
When all of the steric factors are zero, the isotherm reduces to the
mass-action equations. The equations for the isotherm are:
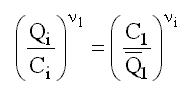


In the above equations, Qi, is the adsorbed concentration of
species 1, Ci is the its fluid-phase concentration, nui
is the characteristic charge of species i, Lambda is the ion exchanger
capacity in equivalents per unit particle skeleton, and sigmai
is the steric factor for species i. Q1 with an overbar
is the concentration of species 1 available for exchange (i.e., not blocked by
a large adsorbed molecule).
Solution Procedure
The equations are solved numerically using a
combination of finite elements, orthogonal collocation, and a stiff ordinary
equation solver. A Galerkin formulation with uniform quadratic finite
elements is used to discretize the bulk mobile phase equations.
Orthogonal collocation is used to discretize the particle phase
equations. This results in a set of Ns(2Ne+1)(2Nc+1) ordinary differential
equations, where Ns is the number of species, Ne is the number of finite
elements, and Nc is the number of interior collocation points. The VODE
solver provided by Lawrence Livermore National Laboratory is used to solve this
set of equations. The local error tolerance for the ODE solver can be
specified. In practice, accurate solutions can usually be obtained with
15-30 elements and 1-3 internal collocation points, and an ODE error tolerance
of 10-5.
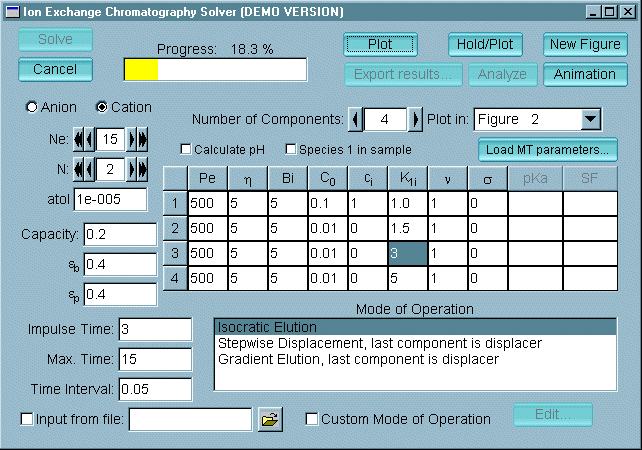 User Interface
The user interface allows the system parameters,
the parameters for each of the components, and the parameters for the numerical
solution procedure to be entered.
The main window provides a graphical interface in which all of the
simulation parameters can be specified.
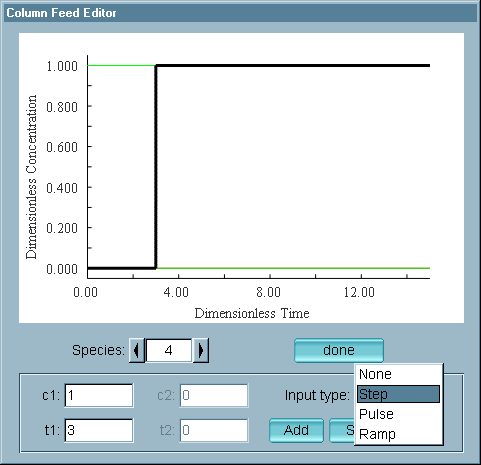 The column feed
can be specified by using one of the built-in modes of operation (isocratic
elution, step displacement, or gradient elution), as a values interpolated from
a
text file, or using the feed editor window to specify a sum of
step, pulse, and ramp functions.
Output
|
|
|
Two ternary separations are displayed, with one data solution
plotted with dotted lines. The displacing salt is not shown.

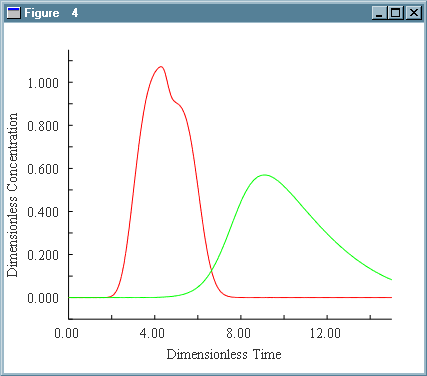
Above left is the
effluent history of a binary separation. To the right is the
position-time plot for this same separation.
The animation window allows the column profiles to be examined at
specific times. The changing column profiles can be viewed like a movie. 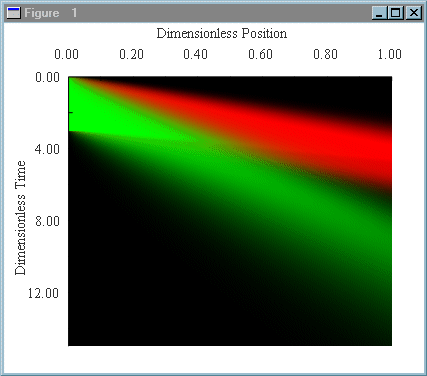
Download
Download (please inquire)
